Insights allows you to build and customise data dashboards for analysis. Get insights into a wide array of Nutritics modules including site performance, menu profitability, carbon performance and waste tracking.
Nutritics Insights includes a Usage Report that allows you to quickly identify all recipes containing a particular ingredient, allergen, or group of similar foods.
Insights is a Premium feature, to upgrade your plan today contact sales@nutritics.com.
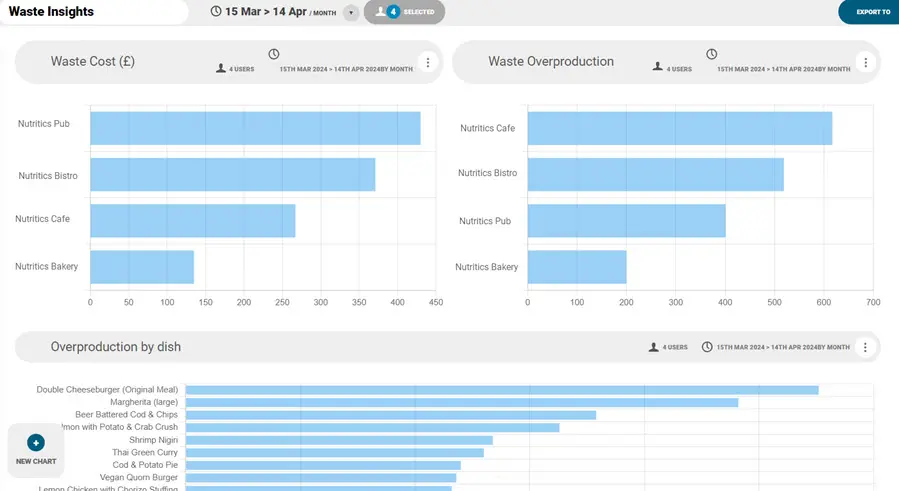
Insights includes pre-configured dashboard layouts that include various widgets for data analysis and operational optimisation.
CREATING A NEW DASHBOARD
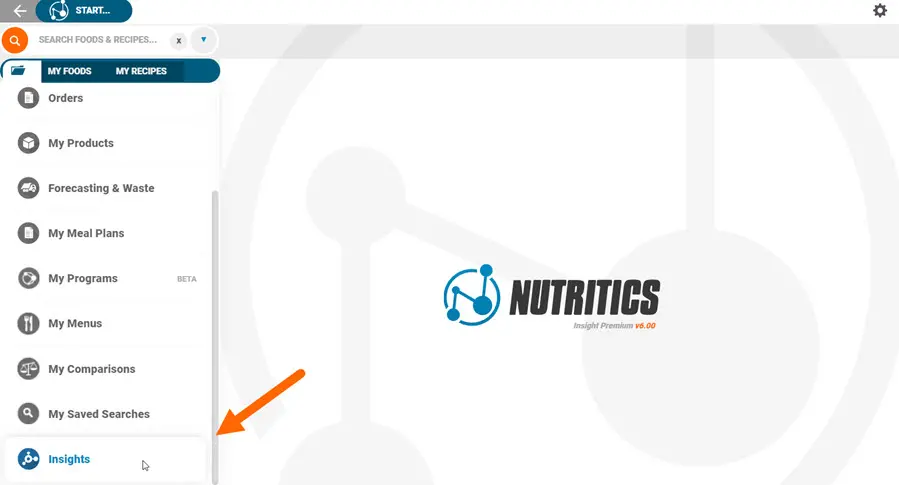
1. Go to the Nutritics Explorer and click Insights:
2. Click ‘+New Dashboard’ and ‘Create A Blank Dashboard’. You can also request a quote to have a new dashboard built by our team including all of the data points you need.
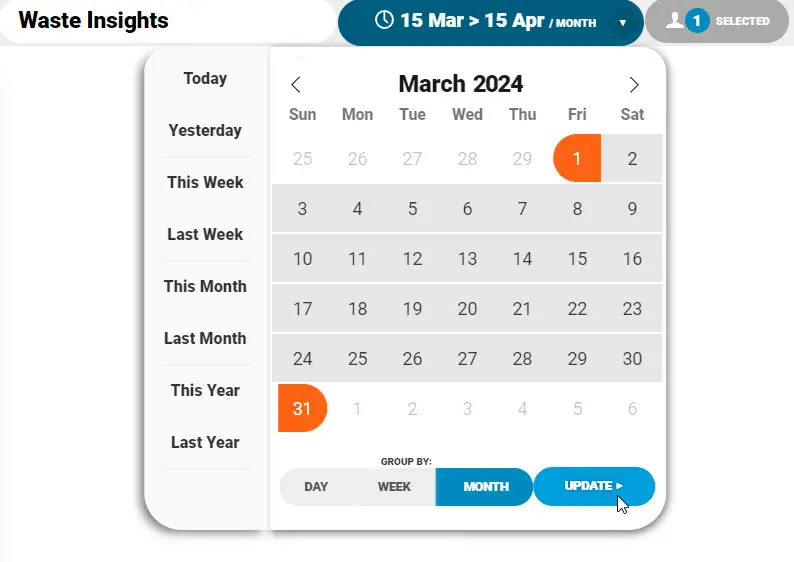
3. Name the dashboard and select what date you would like to analyse for. Some of the data points will be ‘Live Data’ so you cannot analyse for a specific time point e.g. waste can be analysed per time point as waste data is input per day, however, recipe dietary preferences or carbon scoring will always be one data point (live):
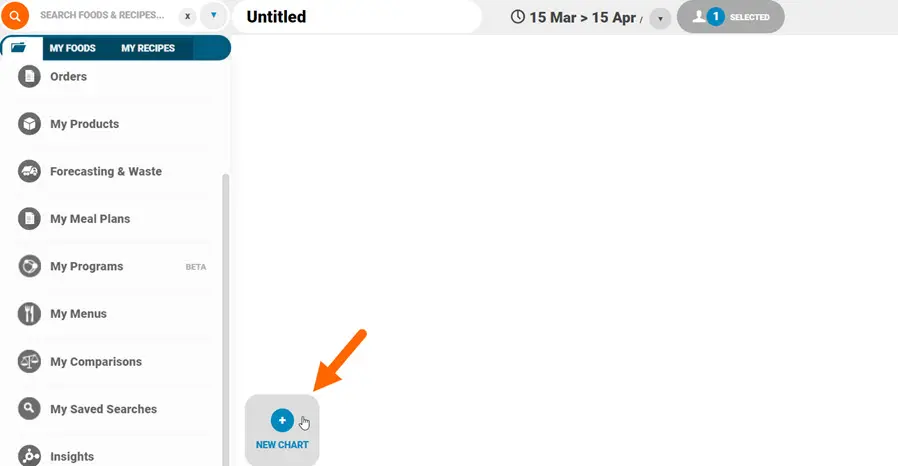
4. Name the dashboard in the top bar and click ‘+New Chart’ to start adding widgets to the dashboard:
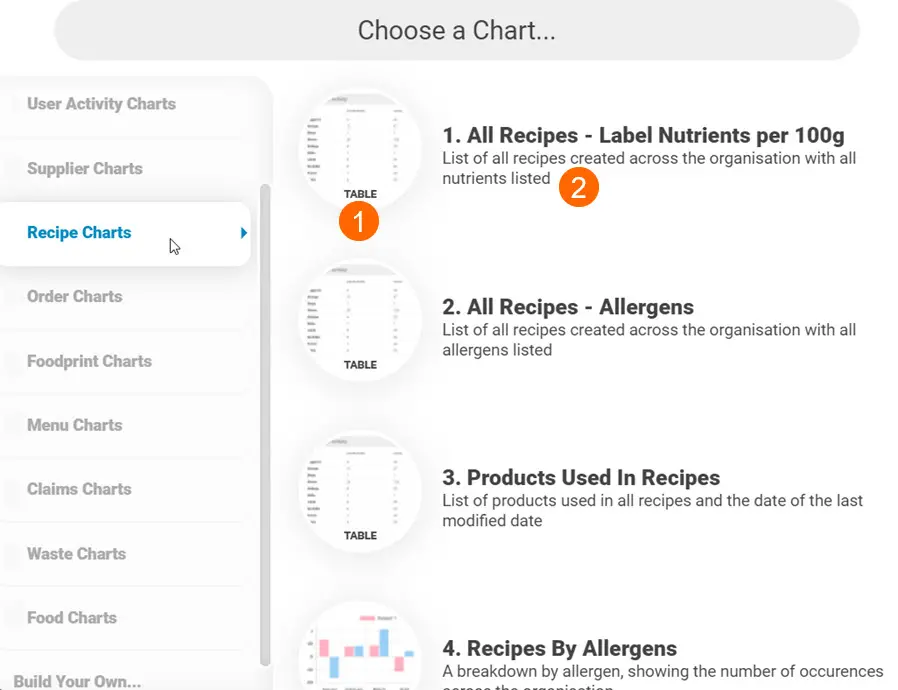
5. Choose what data you would like to add for analysis. For example, you may wish to analyse what percentage of your recipes are vegan, choose Recipe Charts > Recipes by Dietary Preferences.
6. You can see what type of chart the data will be organised into (1) and a brief description of what it will include (2):
7. Highlight the chosen data and click ‘Add to Dashboard’ in the bottom right corner to add this to your dashboard.
8. If you have Insights Premium, you can select additional user data to incorporate into the analysis by selecting the person icon in the top bar of the dashboard. All members of your organisation will show here for selection. You can also enable collaborator groups with ease:
9. You can change the data display by clicking the three dots in the top right of the tab > Resizing, and configuring the size of the block sections. You can then drag and drop the widgets around the dashboard.
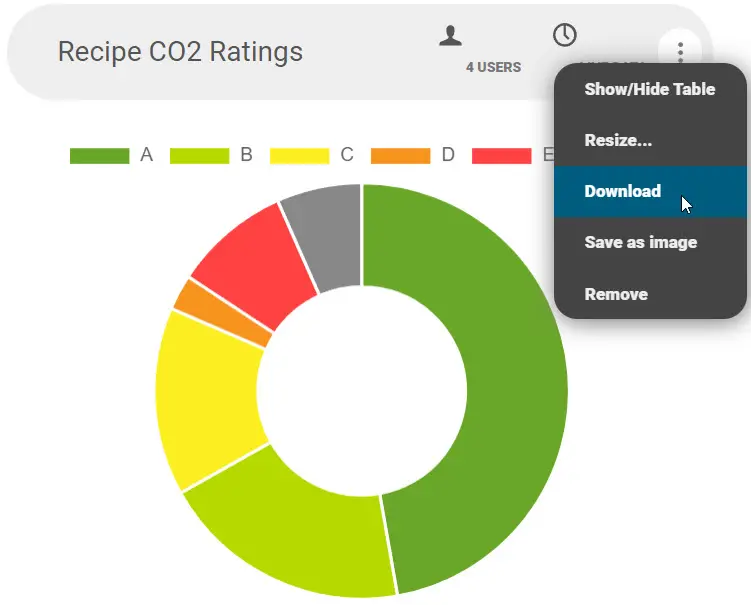
10. Using the three dots, you can also remove, download the individual charts and save as an image:
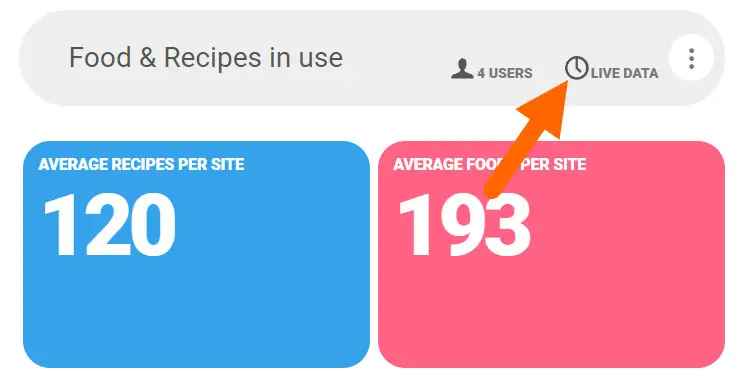
11. Live data will be indicated in the top bar of the widget:
12. Dashboards will save automatically as you work and can be found under the Insights heading in the Nutritics Explorer.
EXPORTING DASHBOARDS:
To export a dashboard click ‘Export to’ in the top right corner of the dashboard
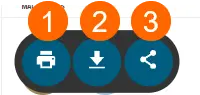
- Report: Preview the data in a new tab. Further share this report via printing (1), downloading as a PDF (2) or using the share link (3):
- Share: Share via a live link. You can also share this link directly to a person’s email address under the Email tab. Download a QR code under the QR tab or view the Embed link under the Embed tab:
- Print: Print a snapshot of the dashboard directly from Nutritics
- PDF: Download a PDF of the menu report