Diet log reports are grouped into subsections under Energy, Macronutrients, Carbohydrate Components, Lipid Components, Minerals & Trace Elements, and Vitamins.
Nutrient intake is represented by the black horizontal bars, while the target intake (Reference Nutrient Intake – RNI) is indicated by a blue line or a blue bar (if the recommendation is a range).
If a Lower Reference Nutrient Intake (LRNI) Safe Upper Limit (SUL) are available, they are represented by the red bars at the lower and upper end of the bar (respectively). If the black bar is within this range, the nutrient name will appear in red font and flagged with a red arrow.
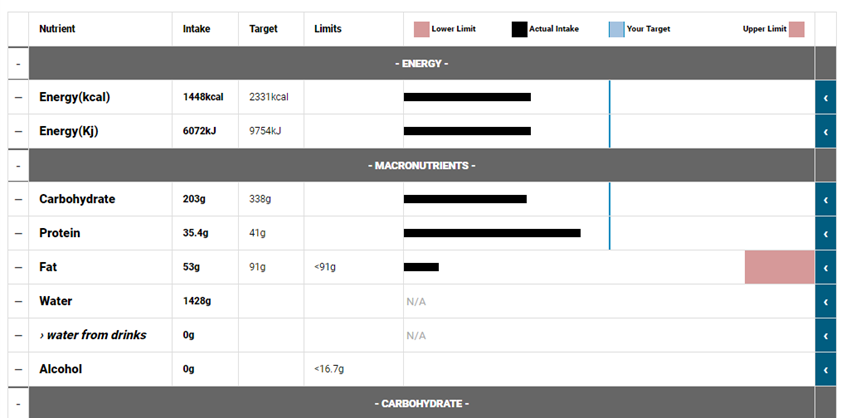
Nutrient intake is also given in numeric form in the ‘Intake’ vertical column, while the recommended intake and limits are given in numeric form in the ‘RNI’ and ‘Limits’ columns. Hovering the mouse over the black bar will display the nutrient intake as a percentage of total of the recommended intake. You can print the percentages on the report in place of the limits by checking the option from Settings > Preferences.