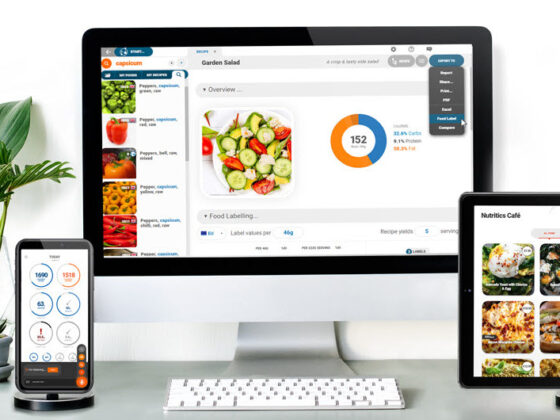
Introduction
Digital menus are becoming more prevalent in restaurants as they can be accessed via screen display, individual smartphones or easy-clean tablet devices. Further to the increased safety and hygiene benefits, digital menus offer a sustainable way of displaying Nutrition and allergen information in a busy ever-changing food environment. Nutritics digital menus are powered by Nutritics professional food analysis software to enable display of both interactive and accurate food information.
The prevalence of people eating outside the home is high with 27% of adults and 19% of children in the United Kingdom eating out once a week or more [1]. Foods eaten outside the home tend to have higher energy and fat content and increased intake of meals out of home has been linked to increased body weight [2]. Providing nutritional information can enable consumers to make more informed food choices.
Since its inception as a concept, calorie labelling has been shown to reduce calories ordered by as much as 11% (93 calories) per order [3]. More recently, in 2020, research shows that there is still extremely high consumer demand for calorie menu labelling to enable consumers to make informed food choices [4].
Nutritics software enables food businesses to accurately calculate nutrient and allergen information. The Digital Menus’ feature provides a seamless way to display this information to customers via digital display, smartphone or tablet - menu information can be accessed via a unique URL or QR code for ease of access.
Objectives
- To calculate and display digital nutrition and allergen information for composite recipes served at a European nutrition conference.
- To analyze interactions and assess acceptability of digital menus.
- To connect stakeholders using digital food information
Methods
In advance of the 13th Federation of European Nutrition Societies (FENS) conference which took place from the 15th-18th October 2019 in the Convention Centre Dublin, we established a communication link with catering staff on site. Menus were built for 11 eating occasions across the 4 days. Recipes were calculated using Nutritics software in accordance with the established protocol [5].
A detailed menu description is received, it’s broken out into recipes and sub recipes. Ingredients are identified and specific nutrient and allergen information are collected at the ingredient level. Ingredients are quantified and sub recipes are created.
Subrecipes are required where multiple cooking processes are applied to make up the components of a recipe, for example the vegetable salad was a subrecipe for the chilli spiced beef bento box.
Ingredients, allergens, and serving sizes were all confirmed by the head chef before the start of the conference day.
A picture was then added to make the menu look visually appealing (figure 1)
Tablet stands and computer monitors were placed around the eating area close to food stands. QR code web links enabled access to the menu on smartphones and personal devices. A QR code is a link which you can scan with your smartphone. Interactions with the menus were recorded and analysed.
A short onsite survey was conducted to assess the acceptability of the digital menus.
After establishing familiarity with the digital menu displays, delegates were asked:
- How do you rate the availability of information on display?
- Would you use this kind of information elsewhere?
Results
Overall, 1654 people from 78 countries attended the conference. 1189 were female, 455 were male, 1 was non-binary and 9 did gender not disclosed.
There were 101 recipes created for the conference. 55 of these were subrecipes and 46 were recipes displayed on the menu throughout the four conference days. 223 foods and 6 different suppliers were used to create these recipes.
The following table shows details of digital menu interactions
Our analysis also showed significant peaked interest during break times with a statistically significantly higher rate of interactions per minute inside break times compared to outside break time. The following graph visually represents the data.
On Site survey results
Of delegates surveyed (n=61), 92% found the information as expected or better than expected and 80% said they would use this information elsewhere.
Conclusion
Overall the perception of Nutritics digital menus was extremely positive considering this is a novel way to present food information.
Interestingly - our study showed a higher rate of menu interaction during breaks compared with outside of breaks, which suggests people are more interested in engaging with food information when presented with food choices.
Based on positive feedback from the on site survey, our findings suggest that Nutritics digital menus are an acceptable way to present food information when eating out of the home and has the potential to promote healthier eating as shown in previous studies where food information is displayed.
The published poster summarising the study and findings can be found
here.
References
Lachat C, Nago E, Verstraeten R, Roberfroid D, Van Camp J, Kolsteren P. Eating out of home and its association with dietary intake: a systematic review of the evidence. Obes Rev. 2012;13:329–46.
Guimaraes NG, Dutra ES, Ito MK, Baiocchi de Carvalho KM. Adherence to a nutritional counseling program for adults with excess weight and comorbidities. Rev Nutr 2010;23(3):323-33.
Adams J, Goffe L, Brown T, Lake AA, Summerbell C, White M, et al. Frequency and socio-demographic correlates of eating meals out and take-away meals at home: cross-sectional analysis of the UK national diet and nutrition survey, waves 1–4 (2008– 12). Int J Behav Nutr Phys Act. 2015 Apr 16;12(1):51.
Deirdre A.Robertson, Peter D.Lunn: The effect of spatial location of calorie information on choice, consumption and eye movements Appetite, Volume 144, 1 January 2020, 104446
C.Manning1, D.Kenny1, D.O’Kelly2, B.A McNulty1, F.E Douglas2 1 . Libro Healthy Towns - Informing protocol for nutrition and allergen declaration.